Introduction
As network automation engineers we tend to focus on writing Python scripts or even applications that connect to devices, run commands, and parse outputs, essentially we focus on automating a bunch network devices…
However, I found as our application grows across multiple devices and workflows or even delves into the use of A.I, application visibility becomes just as important as it’s purpose which is functionality.
Okay there I go, I used the two big letters dominating network automation at this present moment in time – I promised my self, not to discuss A.I in this post, so let’s start again….
In this article, I personally want to explore the difference between logging/monitoring and observability using a simple basic python Netmiko example. I’ll start from a basic script and gradually add logging/monitoring then a observability component.
Why Logging and Observability Matter
As I mentioned above, automation scripts are essentially applications.
When something fails, such as a login, timeout, or even slow API response — you need visibility to answer the three big questions:
- What happened? (Logging)
- Is it happening often? (Monitoring)
- Why is it happening? (Observability)
Observation goes slightly deeper than monitoring or logging. Observation focuses on all the components of a multi-instance application, rather than a single component of an application.
For example imagine you have a multi-instance application which has a front-end, back-end and a back-end database service. An API get request is returning a OK 200 code response as part of logging the API server response. Whilst the serialized JSON response from the database has a single null value in a particular key of the JSON response. Subsequently the observation reveals, there is a issue in the backend service(e.g DB) which should be addressed. As a result observability provides us with a visibility of all the components in the chain, so end-to-end. As opposed to logging and monitoring the application which focuses on a single component(i.e API response)
Logging provides individual event details. Observability gives context and patterns.
1. The Simple Python Netmiko Script
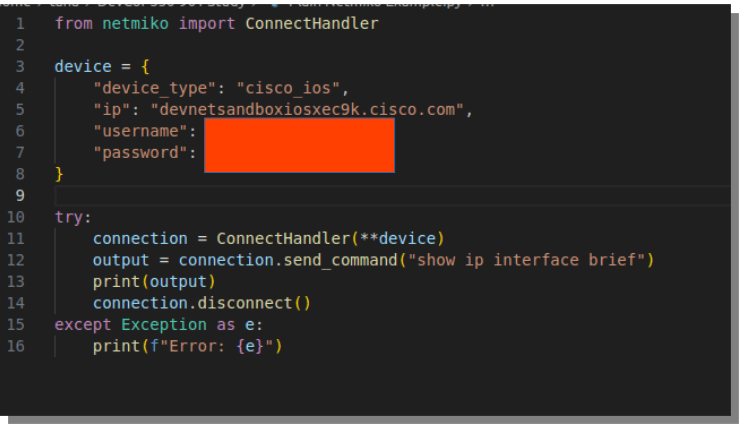
I’ll start with a minimal Python script that connects to a Cisco IOS-XE(Catalyst 9000 Always on sandbox courtesy of Cisco) and runs a simple “show ip interface” command – it is important to comprehend the understanding and differentiation of logging and observability, hence why I used a basic script which most network engineers are familiar with regardless of their network application development skill level.
Here’s the output:
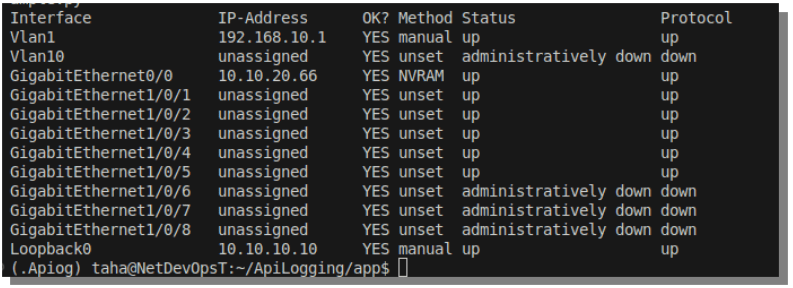
This works fine for one or two devices — but it tells me absolutely nothing about what happened behind the scenes or how long it took…
More importantly what did it perform on our infrastructure?
2. Adding Basic Logging
The Python logging module allows you to record what your script does, along with timestamps and log levels.
The python logging module works on hierarchy bases. The module it self is a built-in python library, it is essentially used to record events that occur when the code is executed.
It’s certainly much more powerful that print() function because it:
- Supports Different severity levels
- Can write to external files, consoles, syslog server etc.
- unlike print() It is specifically designed to assist with debugging and monitoring.
Each log message has a severity level that represents how important the message is:
| Severity Level | Numeric Value | Use Case |
| DEBUG | 10 | full detailed diagnostic info – used in development mainly |
| INFO | 20 | Generic normal events (e.g “script initiated” etc) |
| WARNING | 30 | Something unexpected – but still continues running |
| ERROR | 40 | An error occurred that could potentially affects execution |
| CRITICAL | 50 | Serious error and system may crash |
now it’s important to note, when utilising the python logging module you are manually choosing the severity level.
So yes, you, the network automation developer, is deciding how serious the message is not Python.
Ideally, in well-written code, the severity level you choose should reflect outcome of execution (i.e. the outcome or context of that point in the code).
Python’s logging module does not analyse the code or decide severity on its own, it’s up to you, the developer to log at the appropriate level.
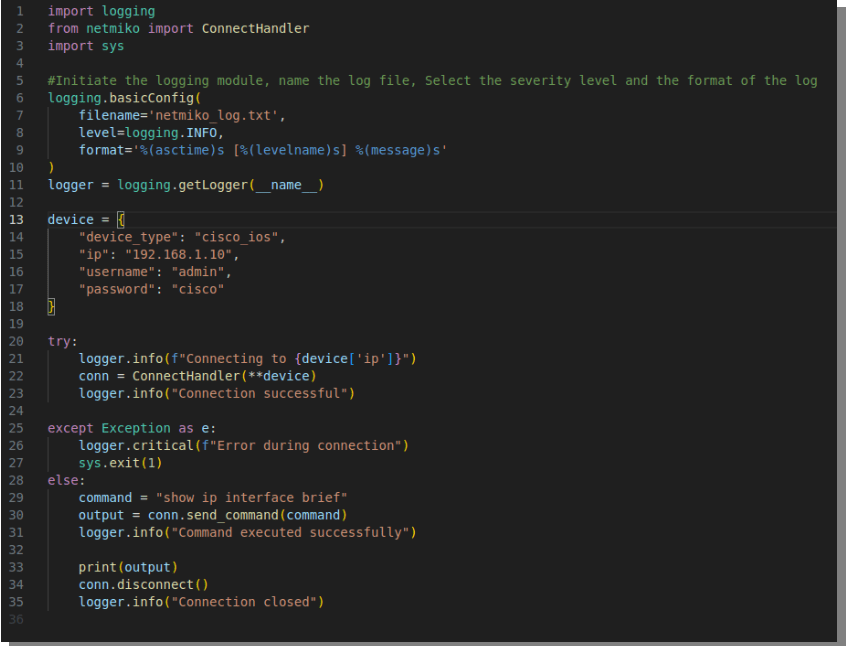
now let’s recreate the script simple netmiko script utilising the logging module. I will intentionally use a the management IP of a IOS device that does not exist :
Here’s the generated log file “netmiko_log.txt”
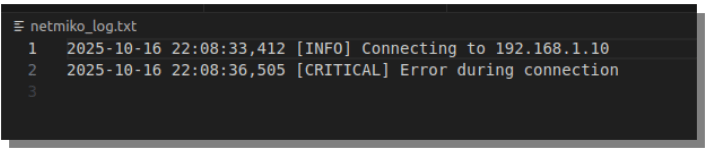
Now, every run leaves a detailed Date/time-stamped log record of what was done, when, and whether it succeeded.
3. Why Logging Isn’t Enough for your automation application
As mentioned previously logging helps you diagnose a single failure, but it doesn’t give you trends or context with metric of the entire application.
For example:
- How many devices failed to connect?
- What’s the average response time?
- Which device is the slowest?
This is where observability begins — turning logs into structured metrics.
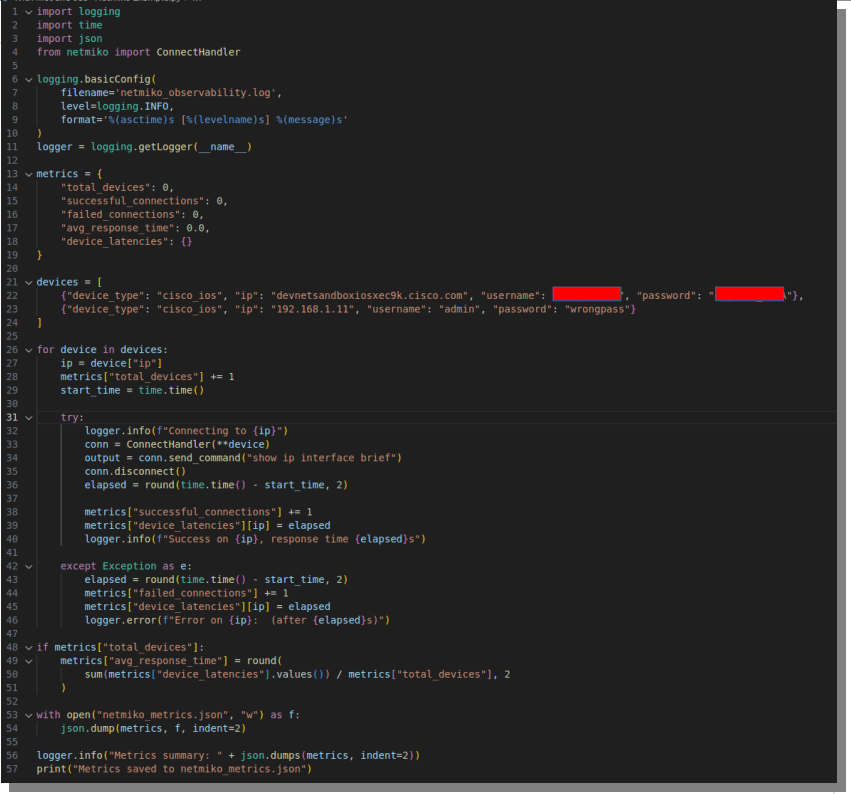
4. Extending the automation script for Observability
We can build simple observability into the netmiko script by tracking metrics such as:
- Total devices processed
- Success/failure count
- Per-device latency
- Average response time
Here’s a version that collects all of these metrics:
Again I have intentionally made one device unreachable so we can collect variation metrics.
Here’s log file output (netmiko_observability.log)

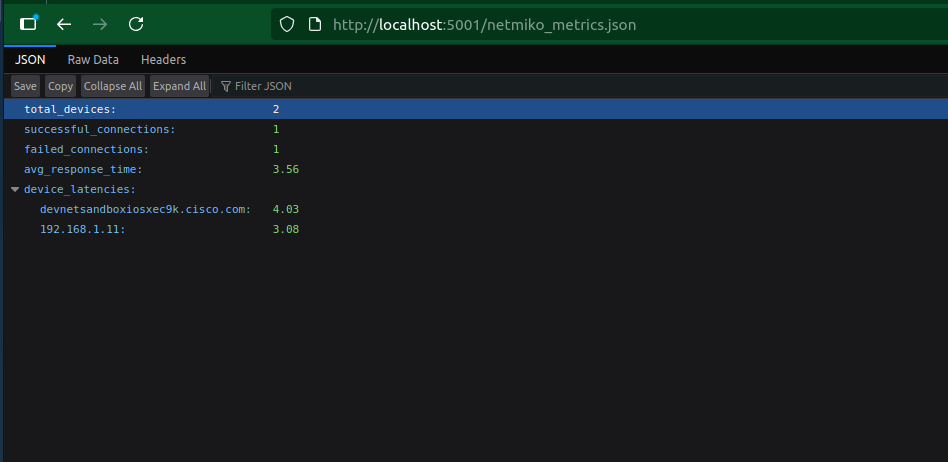
And here’s the output of our serialised JSON format metrics file(netmiko_metrics.json)

5. Comparing Logging vs. Observability
| Aspect | Logging | Observability |
|---|---|---|
| Data type | Text | Structured (JSON) |
| Purpose | Show what happened | Show why and how often |
| Example | “Authentication failure on 192.168.1.11” | "failed_connections": 1, "avg_response_time": 1.88 |
| Audience | Human (debugging) | Systems or dashboards |
| Tools | Files, terminal output | Prometheus, Grafana, ELK |
As you can see here, logging gives you a story.
Observability gives you data-driven context to explain that story.
6. Add the visualisation: Grafana with JSON API Addon
Now that we have collected the JSON metrics from our netmiko script, lets add-in true obervability into our application by parsing the data to Grafana.
You will need to install Grafana – you can simply follow the instruction to install Grafana from the official website:
Windows: https://grafana.com/docs/grafana/latest/setup-grafana/installation/windows
RHEL: https://grafana.com/docs/grafana/latest/setup-grafana/installation/redhat-rhel-fedora/
Debian/Ubuntu: https://grafana.com/docs/grafana/latest/setup-grafana/installation/debian
choose which ever apply to you(I am personally a Linux debian user but for development I always like RHEL developer edition)
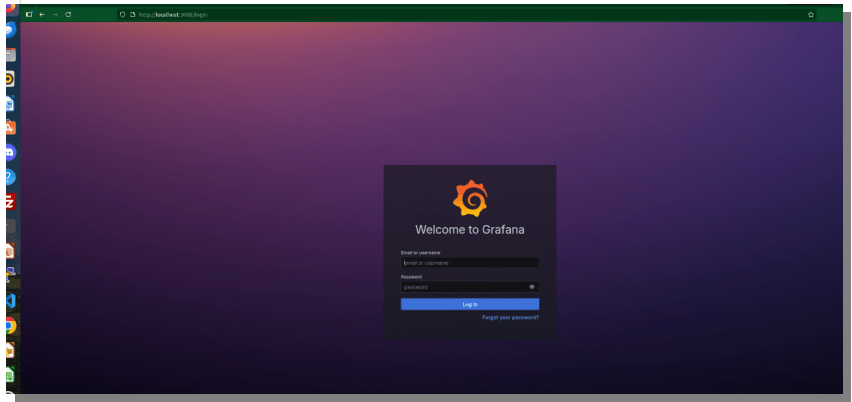
- Login into Grafana:
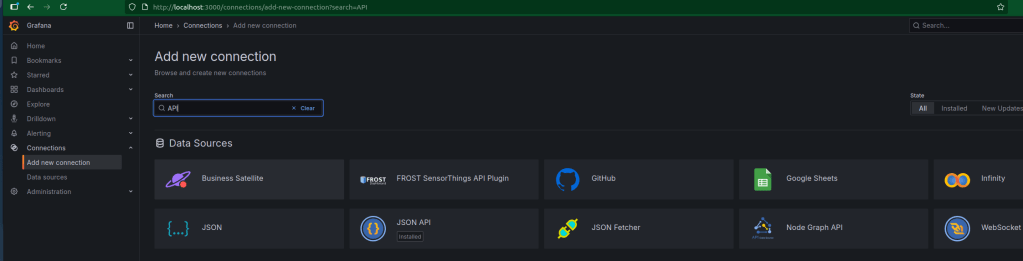
and install JSON API plug-in:
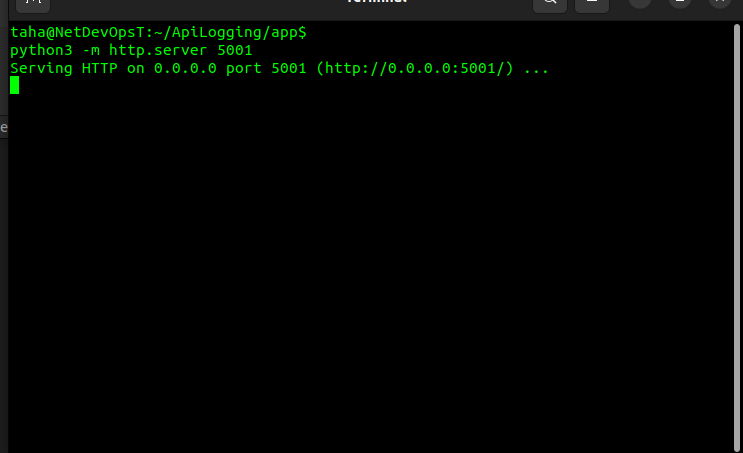
2. On the directory where your metric JSON file output is located run the following command: python3 -m http.server 5001
This will allow you to run lightweight python http server that will forward your JSON metric file.
3. The metric JSON file should now be accessable from:
4. Finally import those query’s(JSON Key/Value) into Grafana:
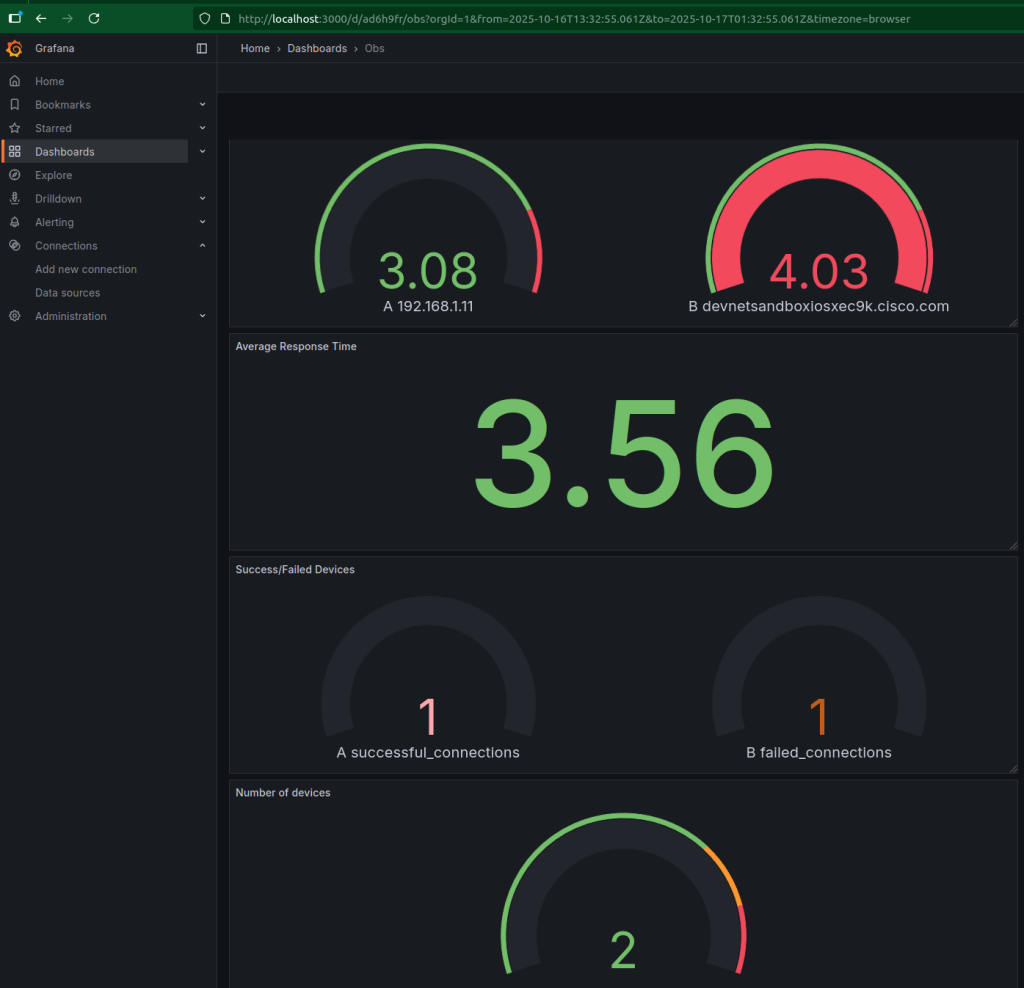
That’s how a simple Netmiko script evolves into a production-grade automation component with visibility and resilience. We now have integrated visualisation into our application and gaining real-time observability metrics.
Conclusion
In automation scripts and application development, success is not only about making a scripts/applications work, it’s also critical to know what your application is doing, it’s about making it observable.
Logging helps you answer what happened, while observability tells you why it happened and how often.


Leave a comment